The report system provides a deeper look into what is happening on your production floor: which machine has the highest availability? Which machines create bottlenecks? How do breaks affect availability?
To get to our report system, choose the ‘Reports’ application from the top menu.
Availability comparison reports
These reports allow you to compare your machines’ availability on different parameters, whether you want to know how a single machine or a group of machines operates during different time-frames / shifts or what is the general availability trend in your factory.
Machine summary reports
These reports allow you to take a look at a single machine on a specific day.
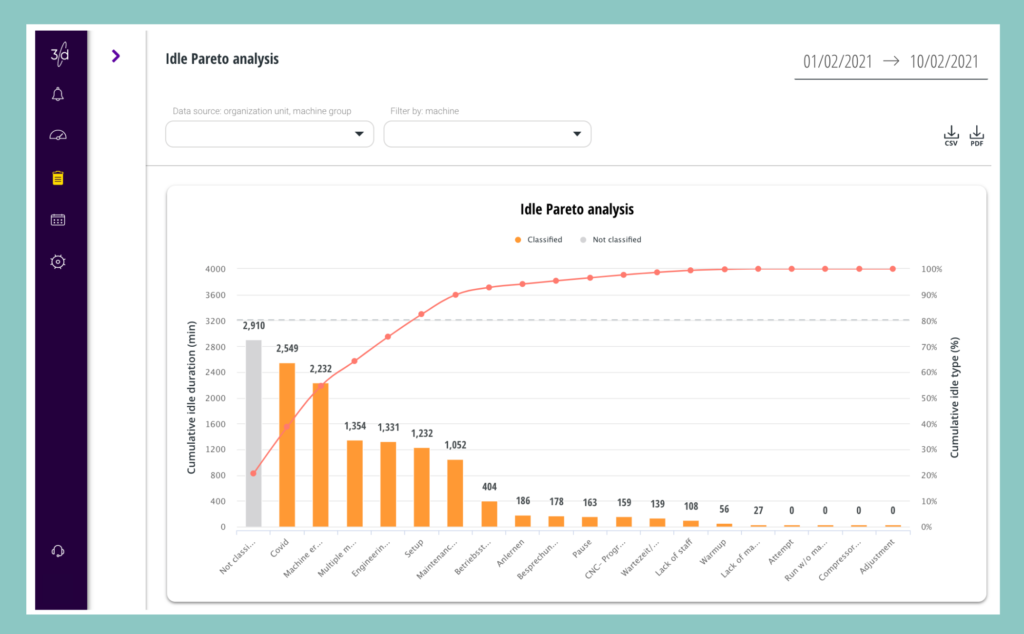
Idle reports
These reports present relevant and usable data about your machines’ idle times. These reports allow you to find the reason for availability loss in your factory and analyze it.
Shift availability distribution report
This report allows you to verify your shift planning and presents the availability distribution between the different shifts.
There is a lot of data that can be harvested from our report system, and there are many different ways in which you can find and extract the relevant information.
1. Where are my bottlenecks?
Almost every process has its bottlenecks. Finding these bottlenecks and figuring out a way to release them might allow your machines to work in a higher capacity and increase your factory’s efficiency and throughput.
Different factories have different reasons for bottlenecks, from delays in the supply chain to delays caused by a single machine. We will focus on the latter:
A possible way to detect bottlenecks in your production floor is by looking at your machines’ availability and searching for a machine with lower availability than that of the rest.
To do that, go to ‘Availability over a time range’ report -> Select the relevant time frame -> Select all the relevant machines (e.g. all machines on a specific production floor) -> Look at the ‘Production/Machine’ graph
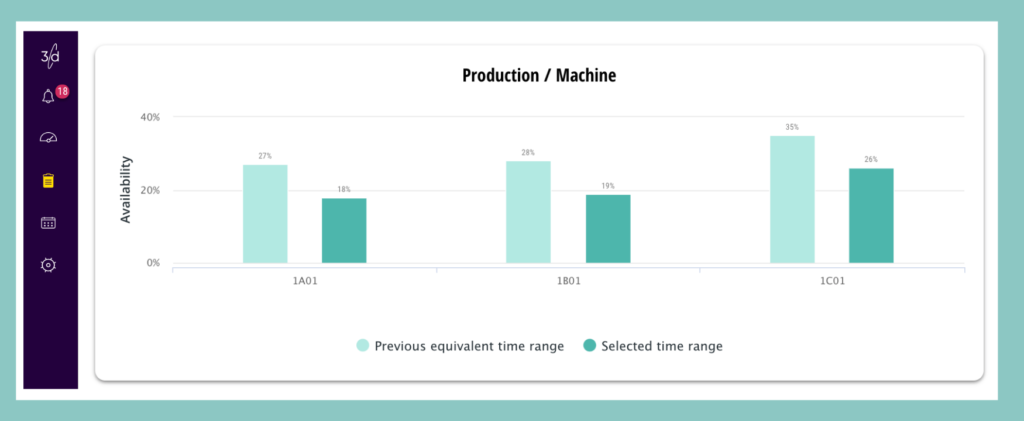
The fact that a machine has lower availability than the rest doesn’t necessarily mean that this machine creates a bottleneck, but knowing about this availability gap might help you better plan your production processes.
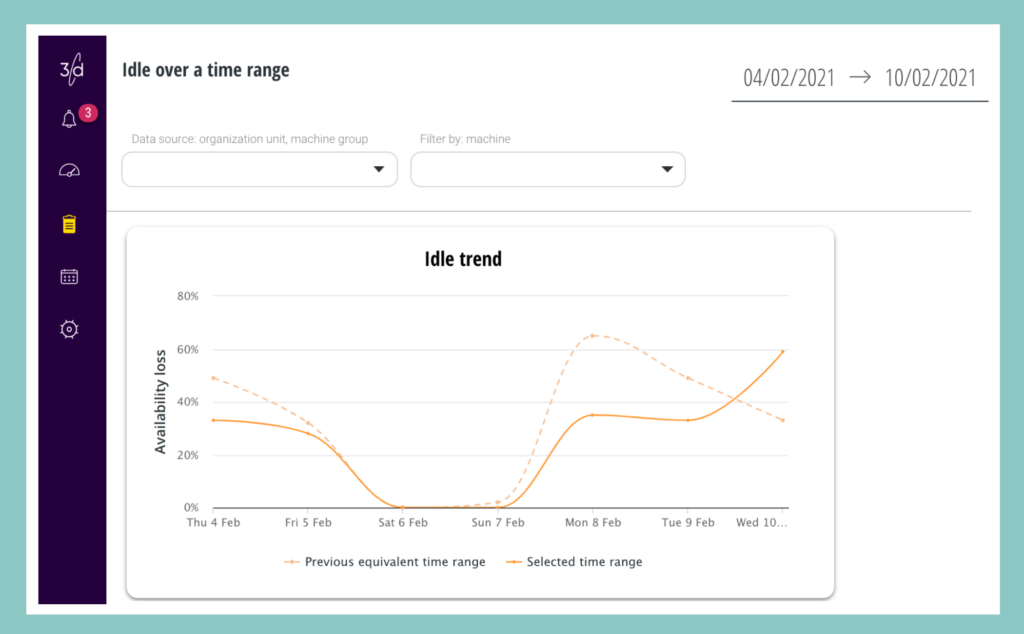
2. What might cause a machine to have low availability?
In many cases, what causes losses in availability are long or unplanned idles. Whenever you see a machine with low or decreased availability, you should check whether there was an increase in idle periods in that specific time frame.
To do so, go to ‘Idle over a time range’ report -> Select the relevant time frame -> Select the relevant machine/s (e.g. a specific machine with decreased availability) -> Look at the ‘Idle trend’ graph and see if there was an increase in idle times/availability loss.
To dive even deeper and get a better understanding of what causes your machines to be idle (and might create bottlenecks), go to ‘Idle Pareto Analysis’ report -> Select the relevant time frame -> Select the relevant machine/s -> Look at the ‘idle Pareto Analysis’ graph to find the most common reasons for idle states for each machine for the time frame you chose.