Understanding the reasons behind machine idle times allows for a unique opportunity to improve machine efficiency by lowering machine downtime. The way to do that? Harnessing the power of data collection and classification.
A new feature in 3d Signals’ dView cloud monitoring, allows machine operators and shift managers to input a reason for each machine’s idle event to enable a better understanding of what is holding up production and deduct how to optimize.
Tracking the reasons behind machine idle time is crucial in order to identify problems and bottlenecks in production. For example, noticing that machine setup accounts for long or frequent idle periods, may lead to considering re-planning of production to decrease the instances when machines switch material/product, thus reducing setup time and saving precious idle minutes.
Another example might be that lack of raw material is a recurring reason for idle events. This can and should lead to a re-examination of the supply chain and warehouse management practices.
Even idle events due to lack of staff might result in a deeper look into how machine operators are scheduled across the different shifts and lead to re-planning.
Being aware of the reasons that repeatedly cause idle events and being able to monitor them over a period of time ensures the optimization of work processes, planning, logistics, and scheduling to improve production efficiency.
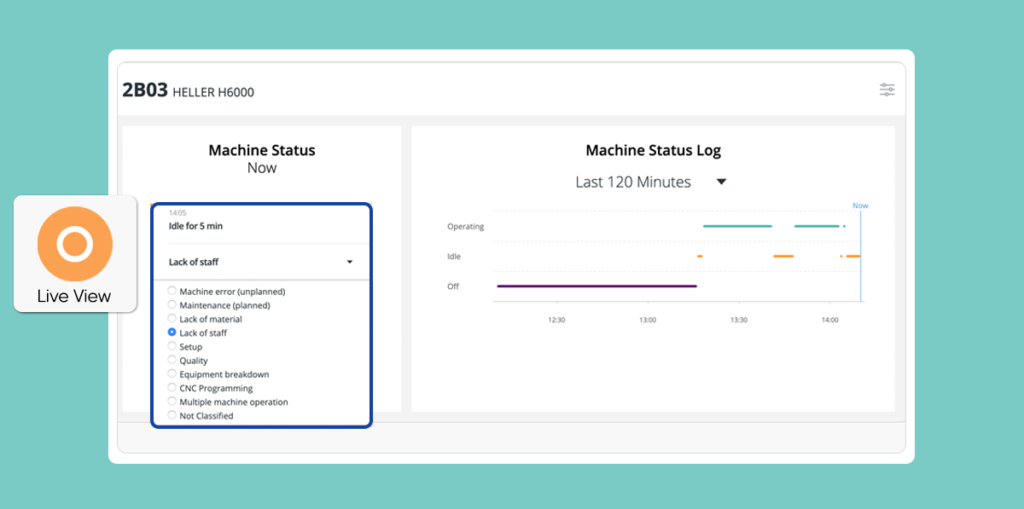
A visual overview of the status of a specific machine (on / idle / off) during a specific shift or a full day.
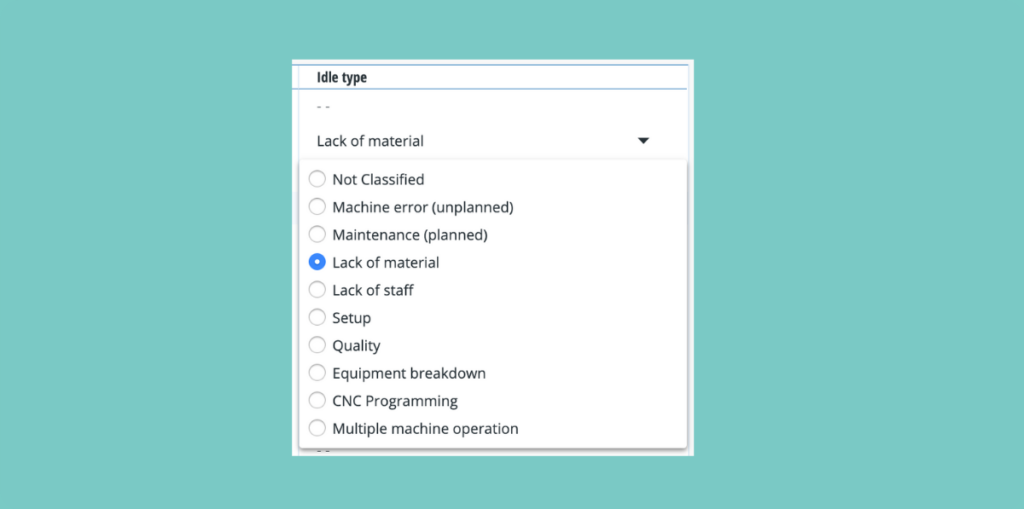
Enables employees to input the reason behind any idle event. Reasons are factory-specific and can be customized based on the manufacturing manager’s requirements. Machine operators or shift managers can classify each idle event with a reason – in real-time or retroactively.
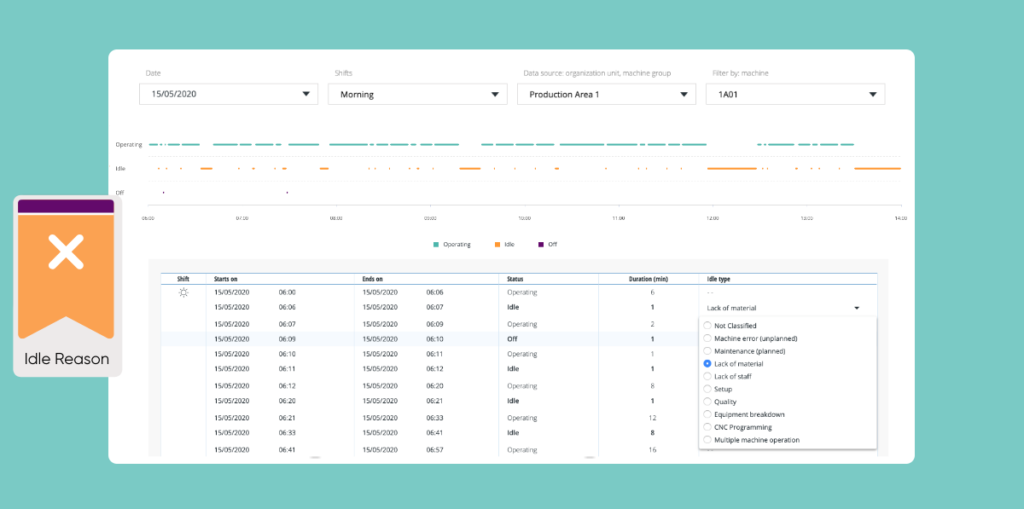
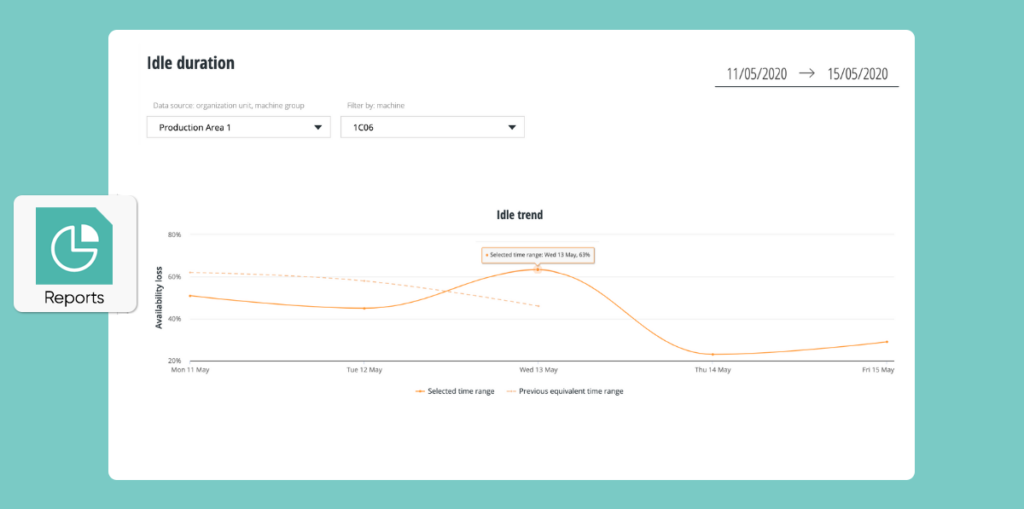
Daily, weekly, and monthly view of idle trends per machine, machine group, and production area.
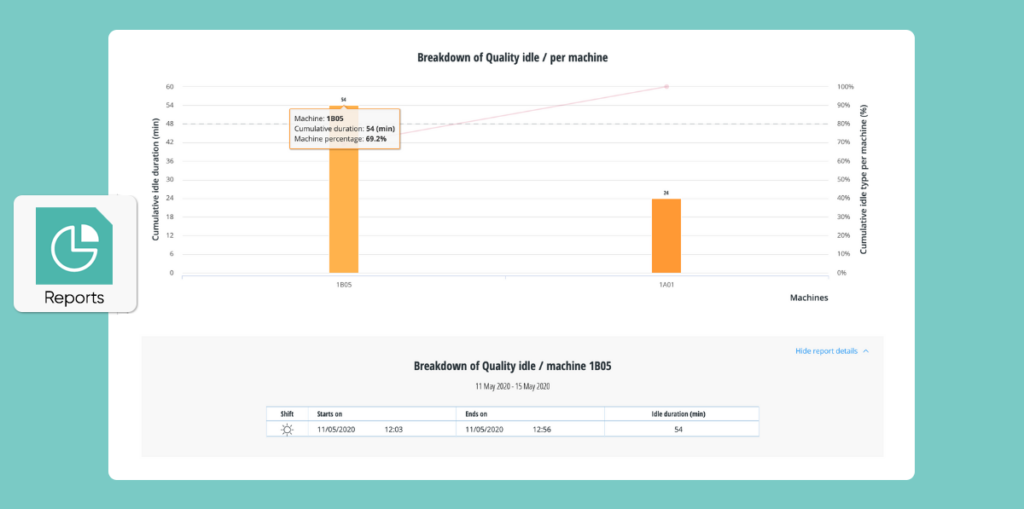
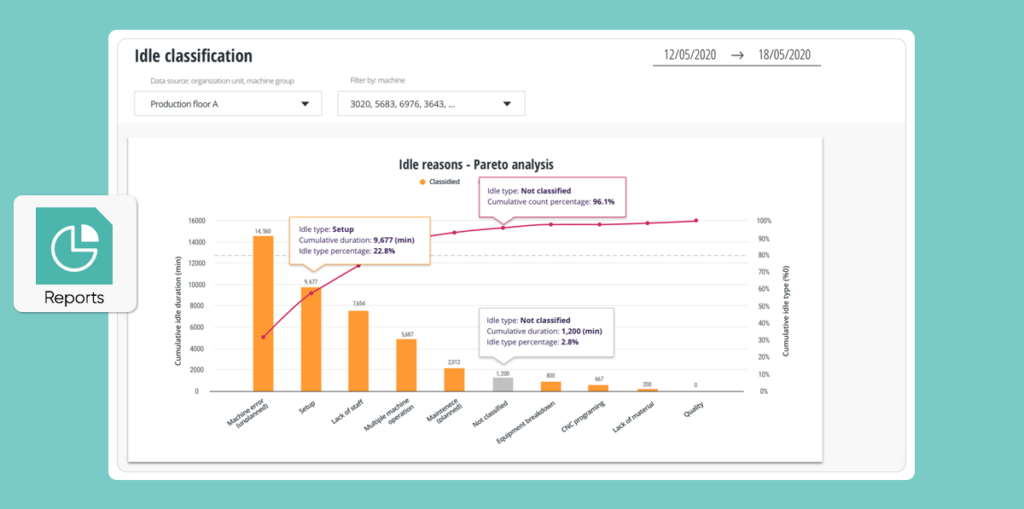
This Pareto report displays the 20% of reasons that cause 80% of idle periods. By understanding the most prevalent idle reasons, managers can resolve most of the issues holding up production by attending to only a small number of problems.
The report provides: